Unique users are those who interact with the virtual assistant only once, while recurring users are those who interact with it on more than one occasion.
You will find user count indicators in both the Dashboard and the Sessions and Customers modules.
Each user is identified by an anonymous ID that the tool generates the first time they access the site on the web channel, or when they send their first message on WhatsApp. Thanks to this, repeat visits by the same user are not counted as new users but as recurring sessions.
However, the criteria used to display data in each section of the Virtual Assistant may depend on the date filter applied. For example, in the Sessions and Clients modules, if a user chatted in January and chatted again in September:
- Analyzing from January to September, they will appear as a recurring user.
- Analyzing from June to September, they will appear as a unique user.
 Below, we explain what information you will see in each of the modules mentioned.
Dashboard: Shows the total number of users (including unique and recurring) who have interacted with the virtual assistant in the current month.
It also shows the percentage comparison with the previous month, indicating whether it is positive, negative, or neutral based on the colour and direction of the arrow: green for positive, red for negative, and blue for neutral. The annual evolution of this indicator is also shown in a graph. No data will be affected by the date filter you apply.
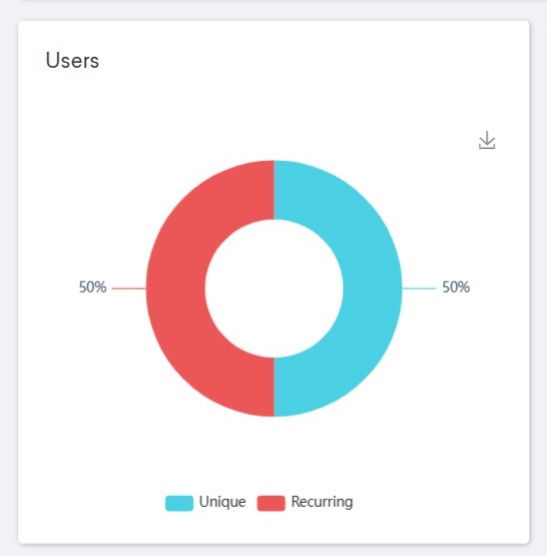
Sessions: The user graph, in ring format, shows the number of unique and recurring users and the percentage corresponding to each for the period analyzed. In other words, it is impacted by the date filter you select.
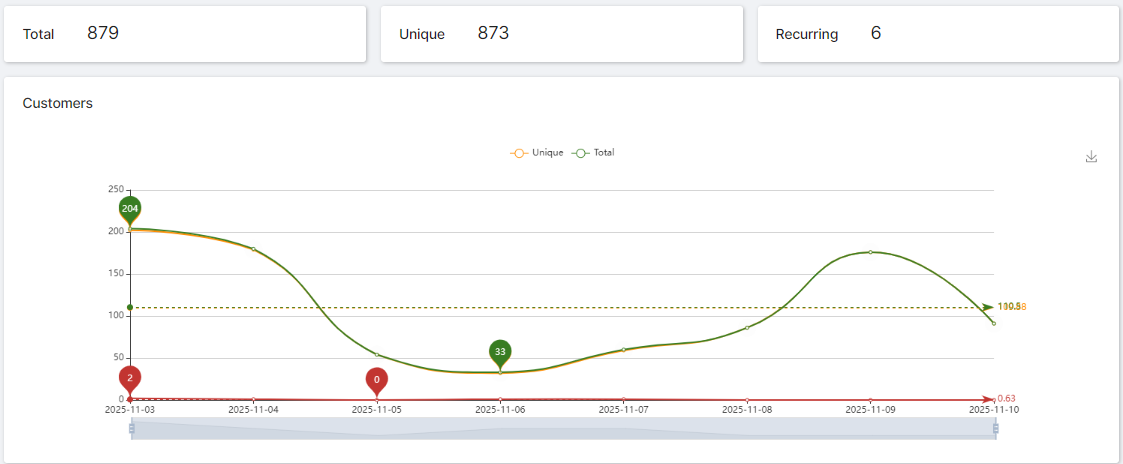
Customers: You will see the total number of users who have had at least one session with the virtual assistant. The number of unique and recurring users will be shown separately. This information is also displayed in a line graph. The results you see depend on the date filter applied, i.e., the period you have chosen to analyze.